The web is a dynamic place.
Taken from the perspective of an individual, browsing by a search term and clicking around a website may not say much. One could even argue that web metrics are flawed: maybe that bounce was an accidental click, or that page was unintentionally left open in a browser for days.
But, from the perspective of the ‘big picture,’ these nuances become just that.
Studying over half of the digital automotive market across multiple years allows Dealer.com’s data scientists and analysts to discover some clear patterns. As the chart below indicates, seasonal peaks and dips can be predicted with confidence and correspond with the marketing initiatives driven by manufacturers. March is typically a high point, for example, propelled by ‘Big Game’ campaigns and Presidents’ Day incentives. Summer time is also another peak in the automotive digital landscape as manufacturers push incentives to make room for the next year’s models.

Every Screen Experience Matters
The data gets more interesting when we examine how this traffic is arriving to your site, and where it’s coming from. Ninety percent of all media interactions are now screen-based, [1] and multi-screen behavior is becoming the norm. In 2014, mobile made up 29 percent of total automotive shopping, a year-over-year increase of 54 percent. Tablet was right behind, with a YoY increase of 43 percent.[2]

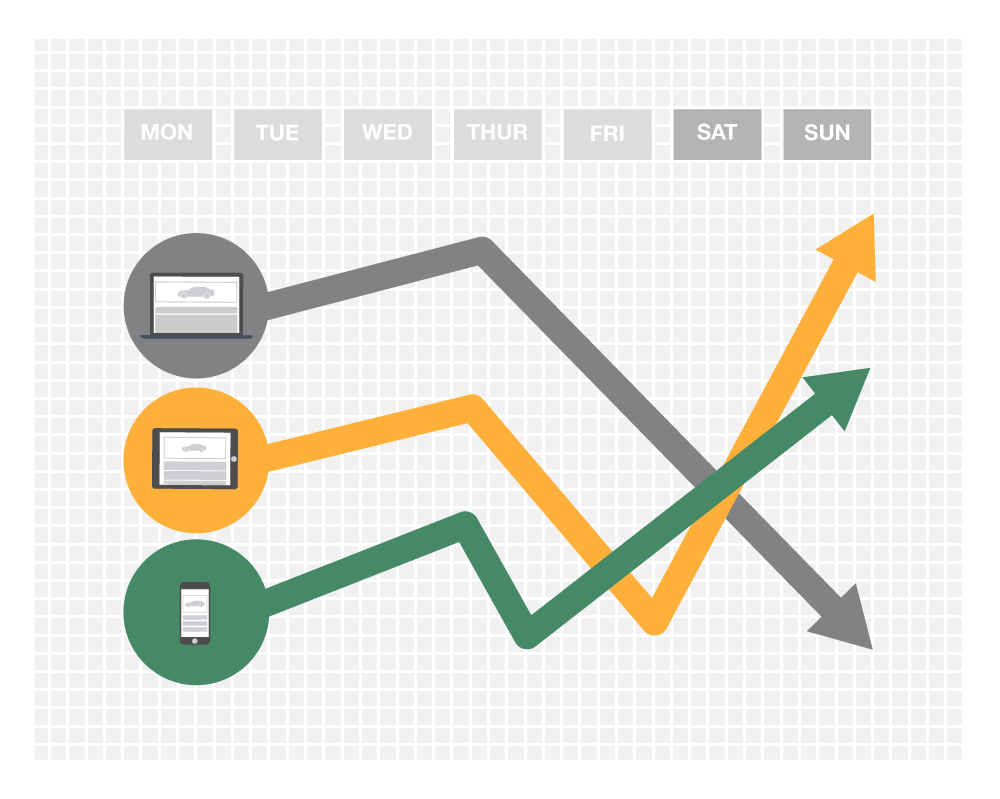
The data suggests that car shoppers are researching their next purchase on a desktop during the week, primarily during working hours. And as the work day ends or the weekend rolls around, mobile and tablet appear to be the device of choice[3]:

All of this information is seemingly obvious, but seeing this extensive data paint the true picture validates our assumptions. And let’s be honest: we’ve all surfed for our next purchase on a desktop during work hours and then at night, in front of the TV, continued our search on a mobile device. Individual contributions may be small, but they certainly add up across a vast network.

With users now moving between screens to accomplish their online intentions, your digital real estate now needs to be a portfolio of experiences that can be optimized across multiple devices.
So What Can This Mean for a Dealership?
A dealer has to manage a lot of moving parts to run a successful dealership, both online and offline. And there are a lot of tools dealers use to accomplish these strategies, most of which require both a monetary and resource investment.
‘Big Data’ identifies global trends happening in the automotive space – both online and even offline. Awareness around these trends can help dealers better understand their performance as it relates to the greater industry.
Some important take-aways include:
– There are certain times of the year where traffic, both to a dealer’s website or to the store, can lull, which may be due to the cyclical nature of the industry. Knowing these seasonal patterns can help identify time periods of true over or under-performance at the dealership level.
– Monday is the busiest automotive traffic day of the week,[2] so it’s important to make sure your merchandise is up to date and well presented by the time folks start their workweek.
– Evenings also tend to be high traffic times. So while bidding may be pretty competitive during these times, it may be worth the investment to maximize ad efficacy.
Above all, the data tells us that digital performance will depend on mobile strategy – not just a mobile website. It’s becoming increasingly critical to be able to analyze each individual screen experience, and tailor strategy accordingly. Indeed, a “responsive” website design isn’t enough. Truly responding to customers requires an understanding of how they shop, and strategizing accordingly. Using insights gleaned from data can help.
Erin Ramsay is Senior Manager, Product Analytics at Dealer.com
For questions or comments related to this post, reach out to erin.ramsay@dealer.com
[2] Dealer.com’s Master Google Analytics Segment
[3] Dealer.com’s proprietary data, collected across 500 randomly sampled dealers between 12/1/2014 – 12/31/2015