Dealer.com engineers use A/B Testing to inform design and boost lead conversion on the new Vehicle Deal Pages
By Jon Ferry and Casey Corcoran, Dealer.com Web Platform and User Experience Team
Dealer.com’s Web Development and User Experience teams use several different quantitative and qualitative research methods to identify solutions that best meet the needs of car shoppers and inform our design decisions. One of our favorite methods is A/B testing.
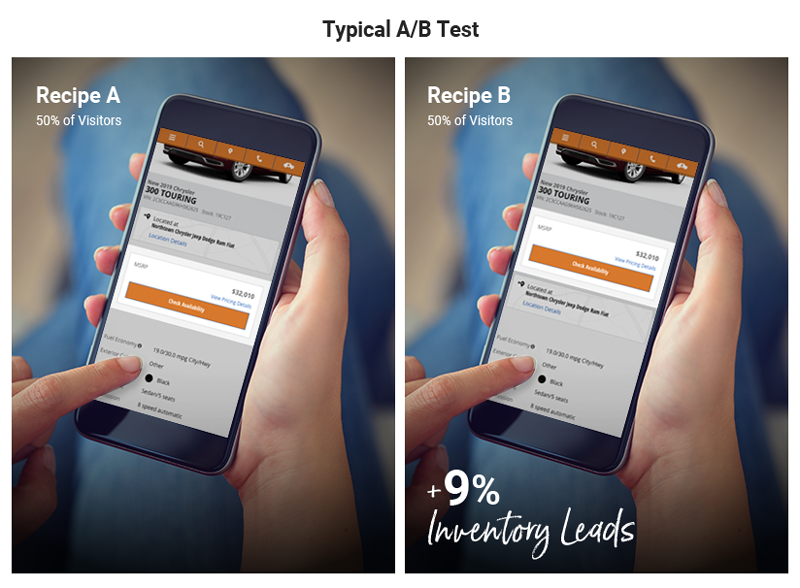
A/B testing compares two or more versions of an experience on your website against a set of predetermined metrics. In the example below, 50% of website visitors see Version A while the remaining 50% see Version B. Traffic to the page is randomized and metrics are analyzed using statistics to understand which version delivers the best outcome.

At Dealer.com, we use A/B testing for two primary reasons:
- A/B testing measures actual behavior. Interviewing car shoppers tells us their underlying motivations and preferences, but A/B testing shows us what they actually do. When the test is over, both the qualitative and quantitative data points tell a more cohesive story.
- A/B testing can detect very small differences in user behavior. Other quantitative research methods can’t measure changes to visitor behavior with the same precision that A/B testing can.
A/B Testing and the New VDP
When we were building the new Vehicle Deal Pages, we conducted interviews with car shoppers to understand what was top of mind when they reached this part of their journey. We learned that shoppers focus on three major areas within the VDP:
- Title – to ensure they are looking at the right vehicle
- Price – to provide a cursory view at affordability
- Photos – to get a closer view at what the vehicle actually looks like
Also notable was that those we interviewed did not want to be overwhelmed by calls-to-actions (CTAs) and stacked pricing immediately on page load:
“I want to know more about the vehicle before I figure out whether or how I am going to pay for it.”
– Mobile Study Participant
After launching the new VDP, many of our Clients asked our Performance Consultants to move their Mobile Pricing Summary sections up the page. We decided to A/B test to see what kind of quantitative change this made to user behavior.
The Pricing Summary Placement Test
A/B testing always starts with a hypothesis—a prediction you create prior to running an experiment. It must state clearly what is being changed and what you believe the outcome will be. For this test, our hypotheses were as follows:
- Adding a new Pricing Module up the page with high level pricing information, a call-to-action to contact the dealer, and a “View Pricing Details” link will increase primary call-to-action engagement and leads.
- Suppressing the Mobile Footer on our new Vehicle Deal Page will not impact primary Call-to-Action engagement or leads. (This would help us quantify the impact of our Mobile Footer).
This resulted in the following multivariate test recipes:

We added an additional summary Pricing Module and experimented with three different placements:
- Below quick specs (recipes B & C)
- Above quick specs (recipe D)
- At the top of the page above our location widget (recipe E)
We also tried recipes that suppressed the sticky footer so we could understand if the footer, (shown in recipe B), made a sizable change to visitor behavior .
What did we care about and want to measure with this particular test?
- Inventory leads – we’re always going to include leads as a metric to ensure that they are not negatively impacted. For this test, we were hoping they would increase.
- Primary call-to-action engagement – button engagement has been a leading indicator for leads in many cases, so we were looking for increases here as well. In all cases the primary call-to-action in this case was related to inventory leads.
Our A/B test ran for four weeks on several websites from different brands and different locales using the new VDP.
Findings
All Recipes tested showed directional improvements in both inventory leads and inventory lead button clicks. Recipe B, however, showed the largest lift, with a statistically significant 23% increase in inventory lead button clicks, and the largest directional lift in inventory leads.

So What?
Following the test, our engineers built a new Pricing CTA Module that has already been deployed to websites using the default VDP layout.
And we’re not stopping there. Recently, we made MyCars treatments more prominent for users who wish to save vehicles. We are also experimenting with the effectiveness of our secondary “Ask” and “Drive” buttons by asking, “Do our customers appreciate the multiple ways they can reach out to a dealer or do they get overwhelmed by the number of choices they are presented with?”
Stay tuned for more updates, as we continue to research other aspects of our VDP design—and your digital storefront at large—so we can be sure we’re delivering the best experience to your customers.